

The 2022 Gartner Cloud Infrastructure & Platform Services [CIPS] Magic Quadrant’s report has only three of four quadrants filled—the Challengers box is empty. To a discerning tech eye, this says one thing about the state of the cloud services market in 2022: The tight league of leaders got so far ahead and cemented their positions that newcomers think the entrance barrier is too steep to even try.
However, there’s enough competition among major cloud service providers to insure competitive client-facing market.
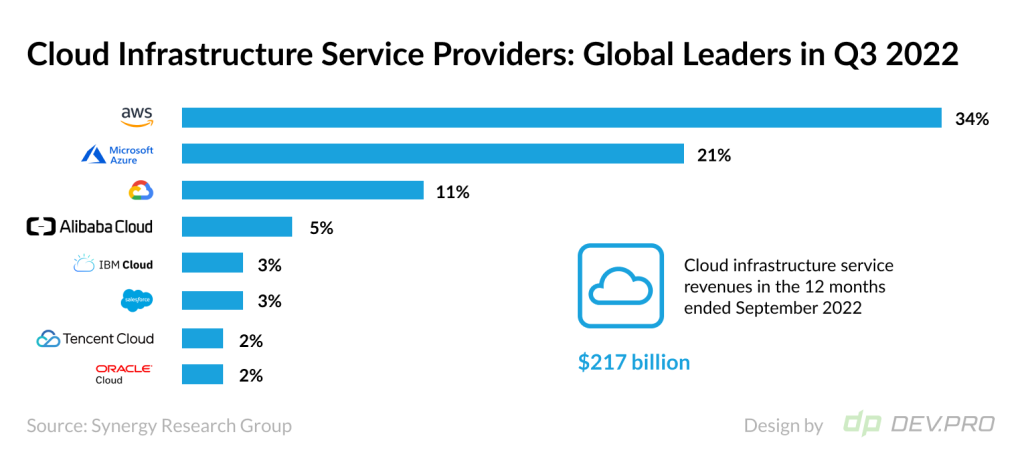
AWS is leading with 34% of the market [almost the same as the sum of shares of the two following leaders: Azure at 21% and GCP at 11%]. However, Alibaba, Oracle, IBM, and Tencent Cloud are worthy players in their own niches—geographical as well as service-wise.
With 94%+ of companies using cloud computing, and global public cloud spending’s projected growth of 20.7% in 2023 expected to reach $591 billion, this tech cloud is the silver lining for global digital transformation.
We have collected the freshest cloud computing statistics to reveal facts and figures on everything cloud: adoption, vendors, security, migration, and storage.
Cloud Computing Statistics 2022 & Predictions for 2023
We have used reputable resources like Gartner, Flexera, Snyk, Bloomberg, AWS, Microsoft, Alphabet, Splunk, Eurostat, and IBM. And for precision, we will provide links to survey sources at the end of this piece.
Cloud Computing Growth Statistics
- Global public cloud spending is forecasted to increase by 21% in 2023 to reach 591.79 billion from 490.33 billion in 2022. [Gartner]
![Worldwide Public Cloud Services Spending Forecast 2021-2023 [Milllion USD]](https://dev.pro/wp-content/uploads/2022/12/Worldwide-Public-Cloud-Services-Spending-Forecast-2021-2023-Million-USD-1024x583.png)
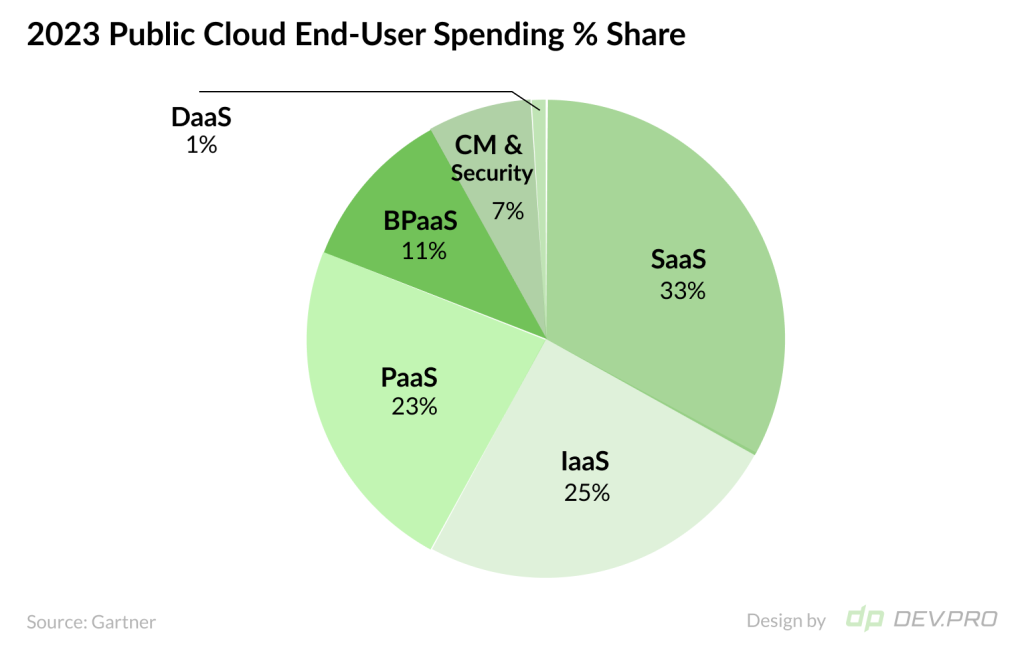
- SaaS is the most popular cloud service model on public clouds, set to comprise 33% of the total public cloud end-user spending in 2023, down from a 34% share in 2022. SaaS model global spending is forecasted to grow to $195 billion in 2023, from $167 billion in 2022, a16.8% increase YOY. [Gartner]
- IaaS is the second most popular cloud service model on public clouds, estimated to be responsible for 25% of the total public cloud end-user spending in 2023, up from a 23.6% share in 2022. IaaS model global spending is forecasted to grow to $150 billion in 2023, from $115.7 billion in 2022, which is a 29.8% increase YOY. [Gartner]
- PaaS, the third most popular public cloud service offering, is forecasted to account for 23% of the public cloud spending in 2023, growing to $136 billion, from $110.7 billion in 2022, an increase of 23% YOY. [Gartner]
- Global private cloud market is estimated to reach $65.98 billion in 2022 and grow at a 29.7% CAGR until 2029 to finish at $528 billion. AWS, Cisco, Dell, Google, HPE, IBM, Microsoft, OpenStack, and SAP are key providers of private cloud services. [Maximize Market Research]
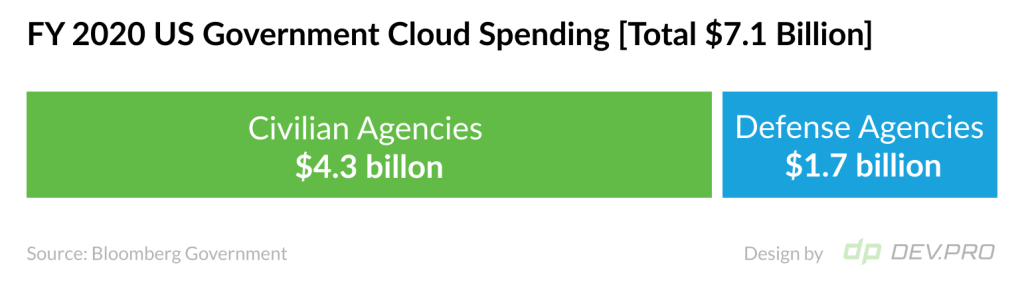
- US government agencies were expected to grow cloud spending from the forecasted $5.9 billion in the fiscal year 2019 to $7.1 billion in FY 2020 in line with Cloud Smart Strategy. Of total government cloud spending, it was predicted that $4.3 billion would be obligated by the civilian agencies and $1.7 by defense agencies in fiscal year 2020. [Bloomberg Government]
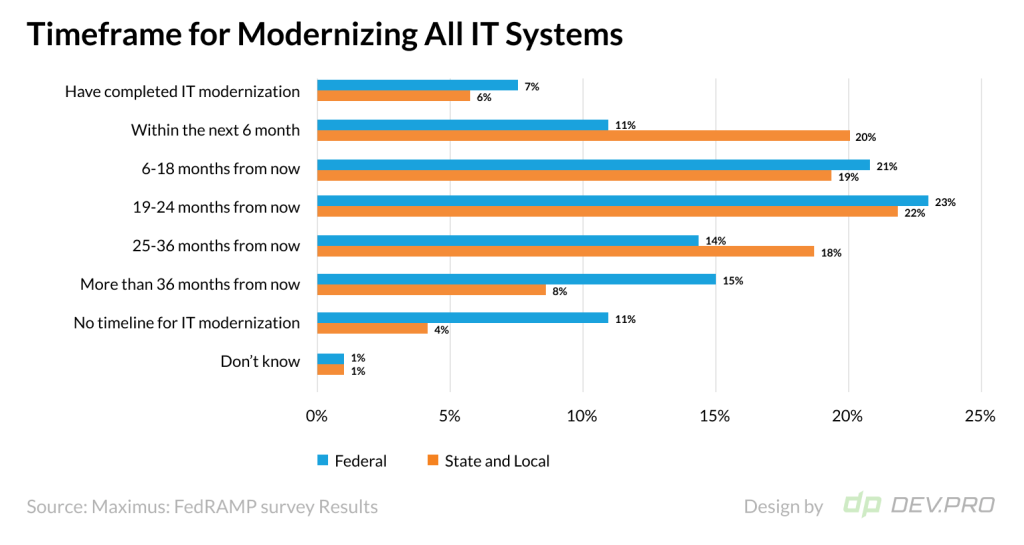
- Only 7% of federal US agencies and 6% of state and local governmental agencies have completed IT systems modernization. Sixty-one percent of state agencies and 55% of federal agencies plan to complete the modernization process within two years. The federal agencies appear to have more extended plans to bring their IT systems up to speed, with 29% estimating that the upgrade will take anywhere from over two years and another 11% working without a timeline. [Maximus]
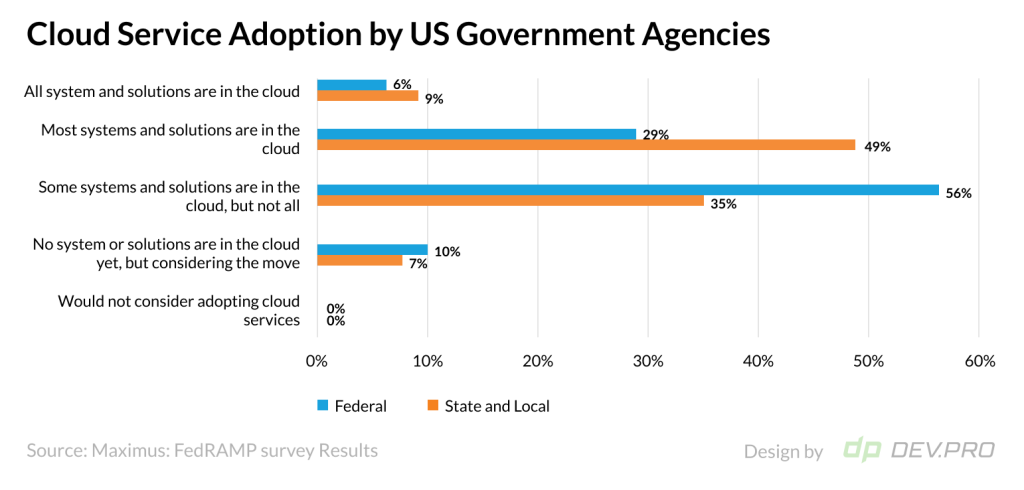
- Cloud computing usage statistics for the US government feature similar trends, as state and local authorities seem to be more willing to adopt the technology. Nine percent report having switched to the cloud completely, nearly half [49%] report that most systems are on cloud, and another 35% confirm a partial switch. Federal agencies, on the other hand, exhibit slower transfer to cloud hosting, as only 6% have shifted all systems, and 29% report most of them moved. [Maximus]
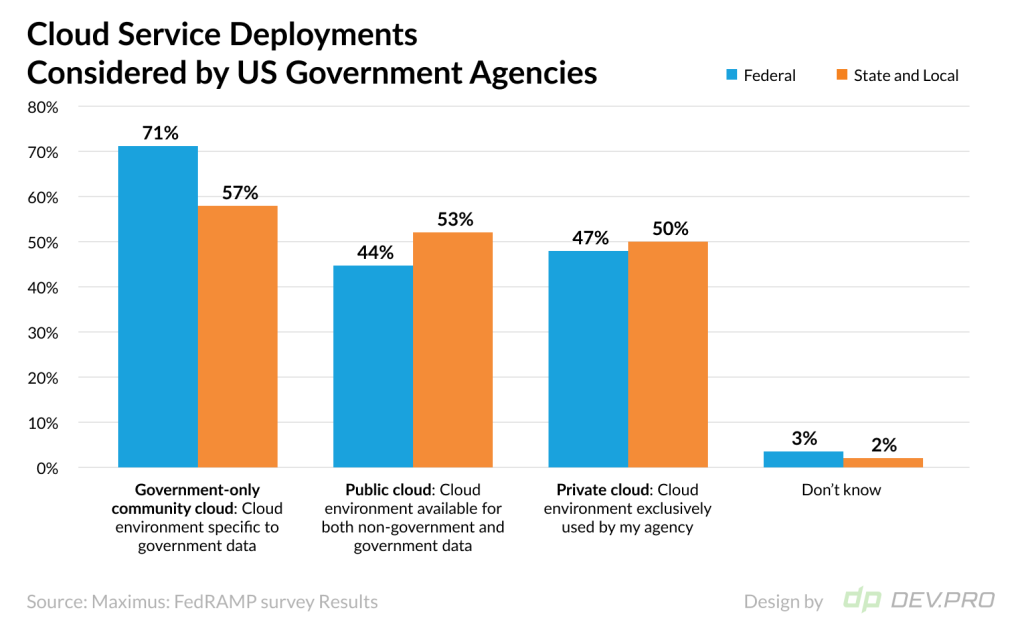
- Community cloud, which is government-use only, is the number one choice by far for both: federal and state agency respondents [71% and 57%, respectively] would consider using government-only community cloud.
Federal agencies are more inclined toward the private cloud deployment rather than public cloud, 47% vs 44%, respectively, if their agency considers using this type of cloud service.
State and local agencies are more open to public cloud usage, driven by respondents from smaller cities, with 53% marketing the public cloud and 50% the private one.
Cloud Computing Statistics
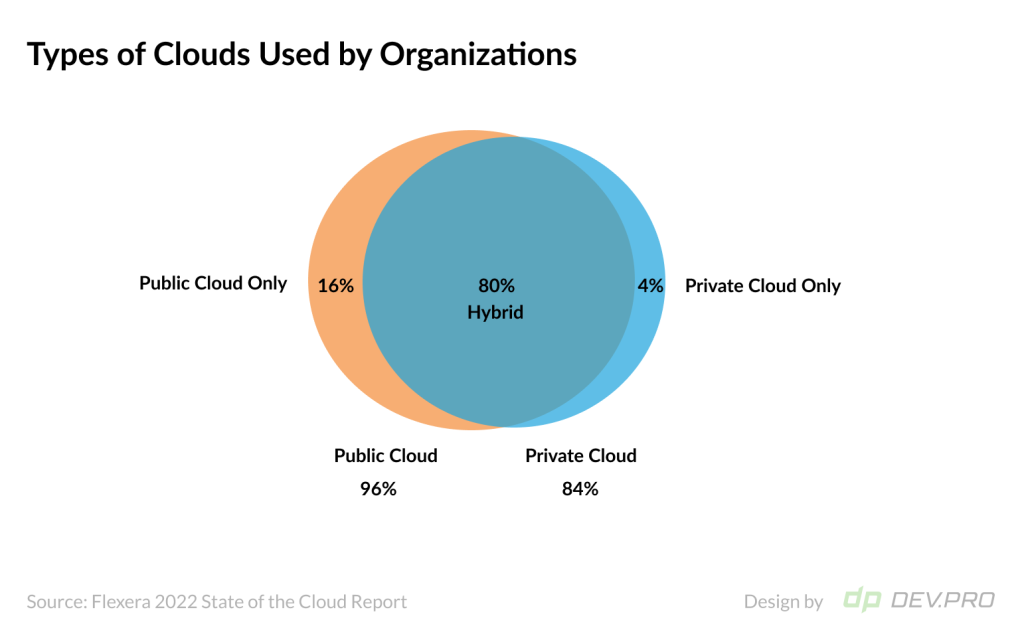
- In the battle of private cloud vs public cloud usage, public cloud wins by a relatively small margin [overall 96% vs 84%, respectively, and 16% vs 4% in the single-cloud setup]. This breakdown comes from a Flexera survey where most respondents are professional users of cloud services hired by larger companies [79% of the respondents work for companies of 1000+ employees]. If the mix of surveyed companies had a higher proportion of MSB, the public cloud could have an even higher penetration due to its affordability. That said, hybrid is still the most common setup, as 80% of the responding enterprises confirmed using both—private and public services. [Flexera]
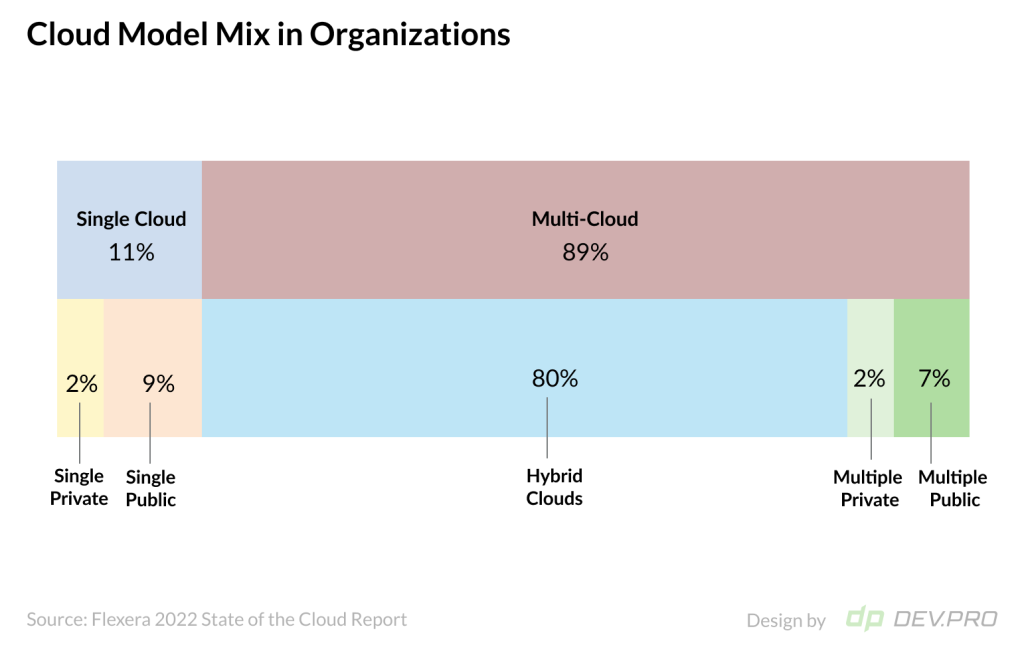
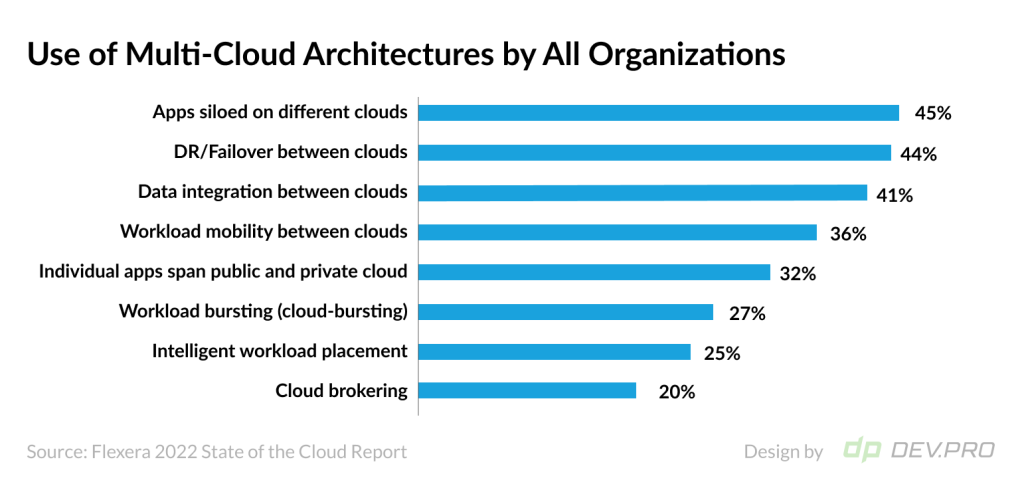
- Multi-cloud vs single cloud environment adoption. Eighty-nine percent of companies use multi-cloud environments [80% on a hybrid setup] and 11% adhere to a single cloud service vendor [9% using the single public cloud and 2% the single private cloud]. [Flexera]
- Popular purposes for using multi-cloud include Apps siloed on different clouds at 45%, DR/Failover between clouds at 44%, followed by data integration (41%), and workload mobility between clouds (36%). Less than one-third of the organizations [32%] use the multi-cloud set up so that individual apps can span them.
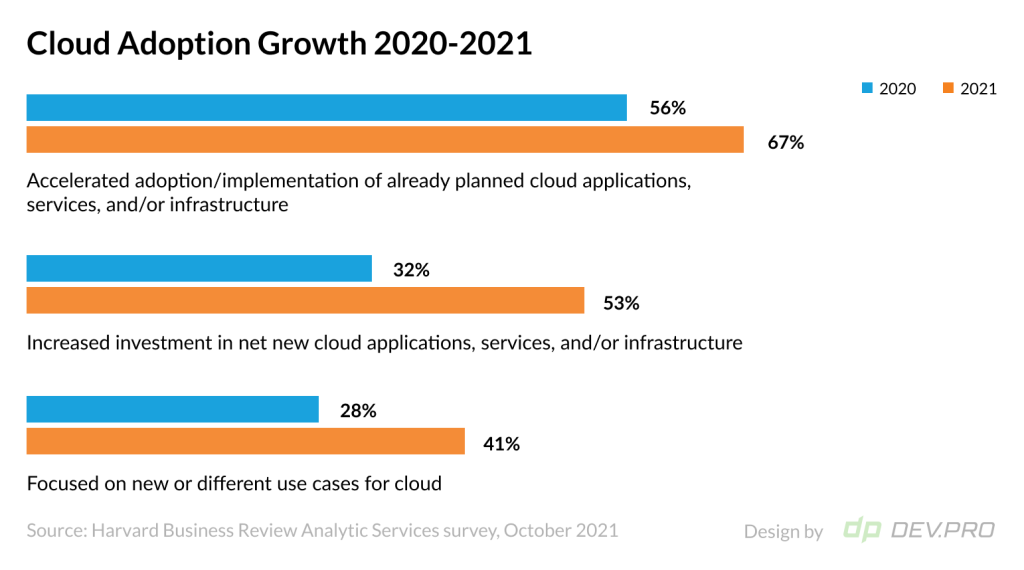
- Sixty-seven percent of organizations have increased their efforts to adopt and/or to implement the planned cloud apps and services in 2021, an 11% increase over 2020’s figure of 56%.
At the same time, 53% of companies confirmed they will invest more in new cloud services and infrastructure, which is an even bigger growth YOY, as only 32% considered purchasing new tools in 2020. [Harvard Business Review Analytic Services survey, October 2021]
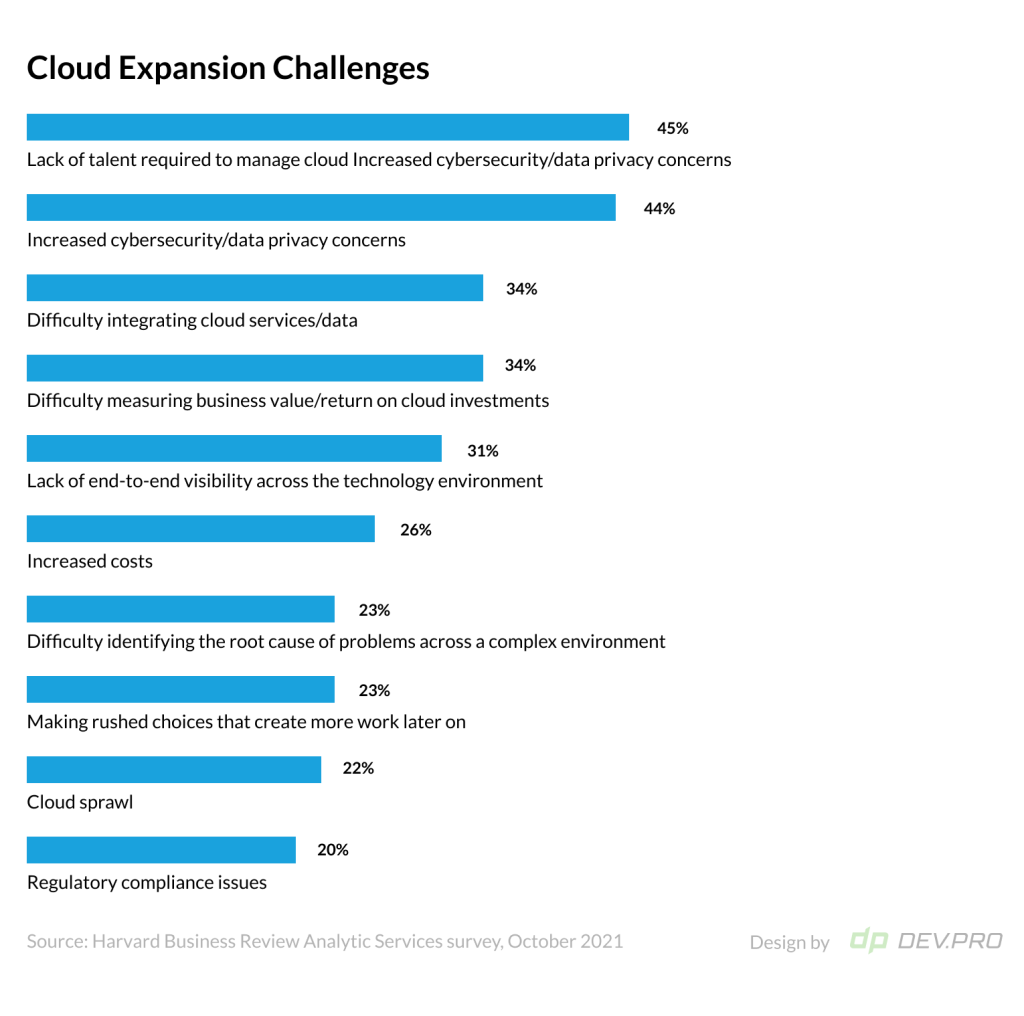
- HBR’s top 10 cloud expansion challenges include these reasons:
- Lack of talent required to manage the cloud – 45%
- Increased cybersecurity/data privacy concerns – 44%
- Difficulty integrating cloud services/data – 34%
[Harvard Business Review Analytic Services survey, October 2021]
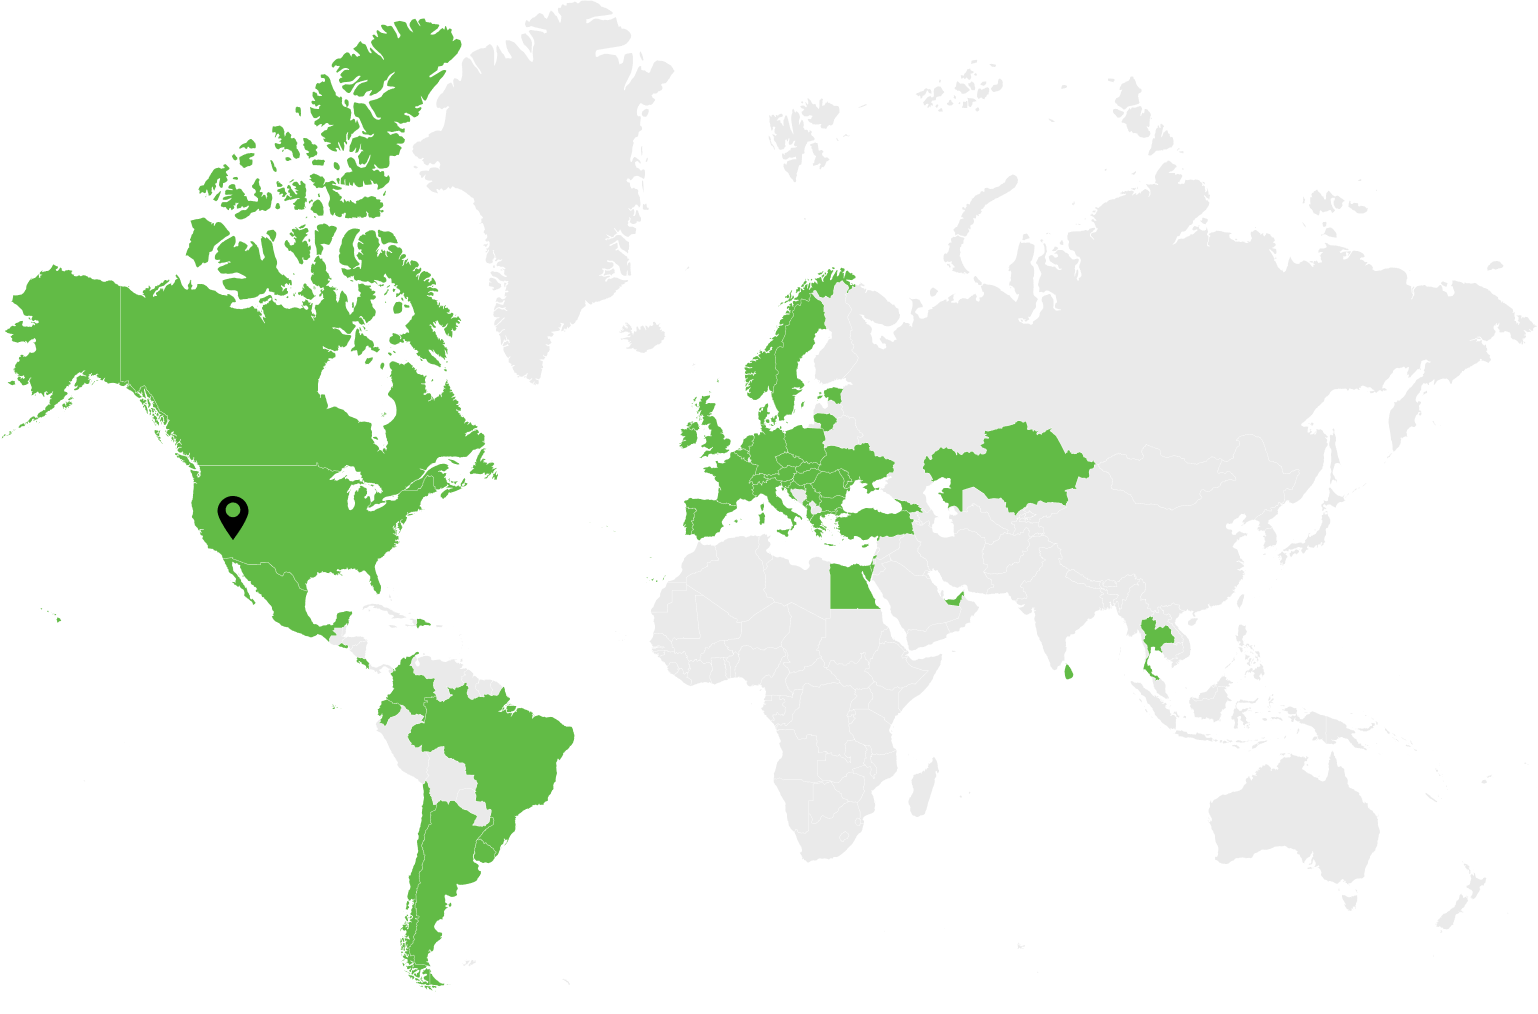
- When it comes to cloud computing adoption statistics in Europe, the most recent data from Eurostat highlights the cloud tech penetration in the corporate segment. This data set for the years 2020 and 2021 includes companies with 250+ employees.
European Union [27 countries as of 2020] cloud usage statistics for companies of this size grew from 65.9% in 2020 to 71.6% in 2021.
A bigger European Geo set called Euro Area [EA11-1999, EA12-2001, EA13-2007, EA15-2008, EA16-2009, EA17-2011, EA18-2014, EA19-2015] grew from 67.2% cloud service penetration to 74.1%.
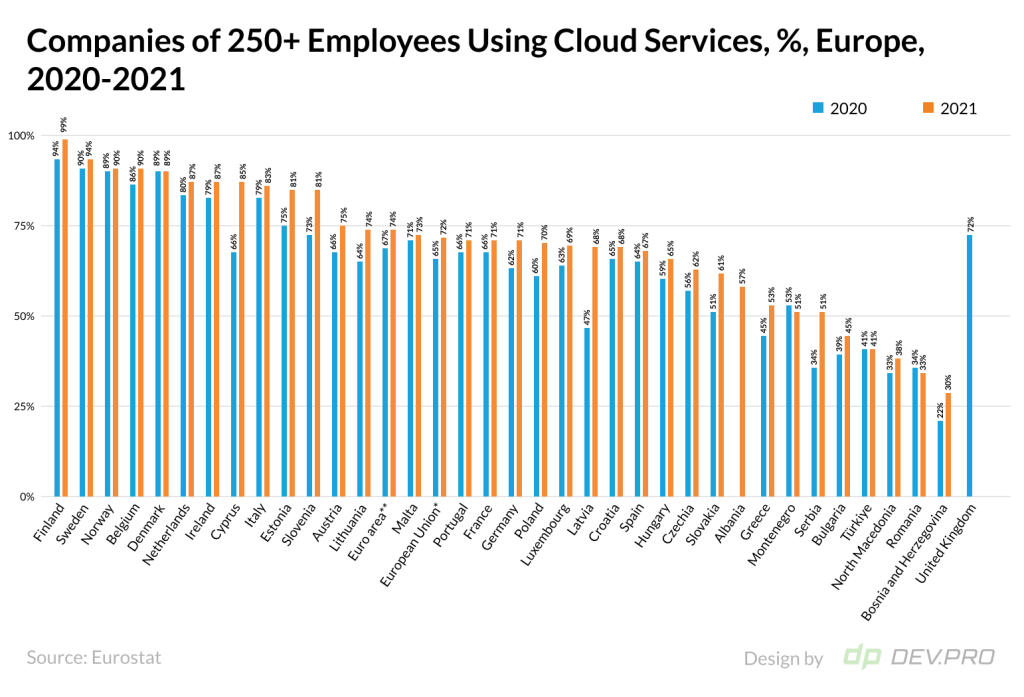
- Going deeper into the country breakdown, it’s safe to summarize that most larger companies in Europe use cloud technology, with just five smaller states registering less than 50% adoption. Many western European countries have integrated this technological commodity quite extensively, with 18 reaching over 70%.
Finland, Sweden, Norway, Belgium, and Denmark have the highest cloud adoption statistics on the European continent, with 2021 figures reaching 98.8%, 93.9%, 90%, 89.7%, and 89.3%, respectively.
See the full Eurostat figures-based table below:
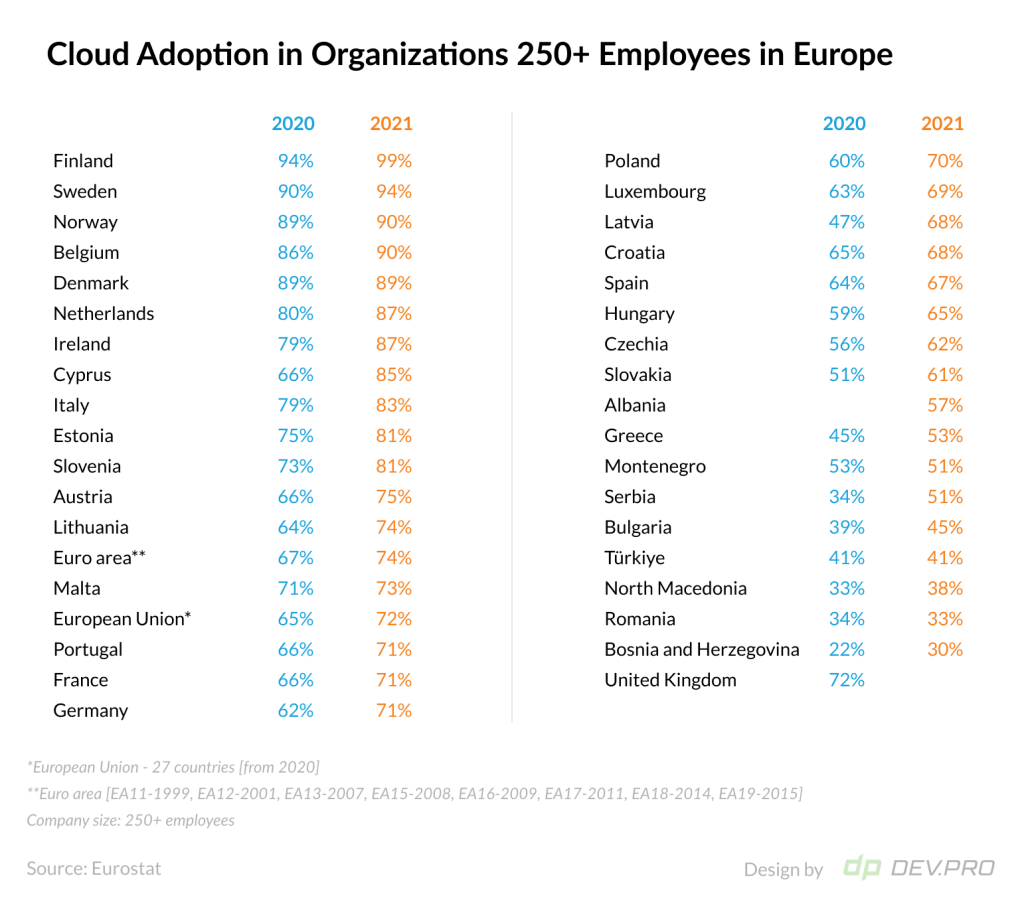
Please mind these clarifications when reading the data:
- European Union – 27 countries [from 2020]
- Euro area [EA11-1999, EA12-2001, EA13-2007, EA15-2008, EA16-2009, EA17-2011, EA18-2014, EA19-2015]
- Company size: 250+ employees
- Iceland data are missing for 2020 and 2021
- Albania and United Kingdom have partial data available
- Seventy-eight percent of companies have hybrid/multi-cloud set up as the priority – for cost saving, security, and availability reasons. [Google Cloud and IDG]
Cloud Provider Market Share
Amazon leads the cloud service market with just over one-third of the global cloud market share in Q3 2022, according to Synergy Research Group.
- The three leaders of the global cloud market are AWS, Azure, and Google Cloud [34%, 21%, and 11%, respectively], followed by Alibaba Cloud, IBM Cloud, Salesforce, and Tencent cloud. The market share data are based on Q3 2022 figures. [Synergy Research Group]
- Amazon.com, Inc. reported an increase in its AWS net sales of $14.3 billion dollars in the first three quarters of 2022, compared to the same period in 2021, reaching $58.7 billion in net sales. With AWS operating expenses of $41 billion in this period, the operating income reached $17.6 billion in Q1–Q3 2022. However, AWS’s income compares favorably to the ecommerce segment of Amazon.com, Inc., as both other major subdivisions [North American and International] finished the three quarters with negative operating income of $2.6 and $5.5 billion, respectively. [Amazon.com Q3 results]
- Google Cloud products comprise 7.45% of Alphabet INC’s total 2021 revenues, amounting to $19.2 billion. This was an impressive 47% growth compared to $13 billion in cloud services revenues in 2020. However, the operating income was still in the negative even though it decreased by $2.5 billion to $3.1 billion in 2021. [Alphabet INC, Form 10-K]
- Microsoft Cloud revenue in the Q3 2022 was $25.7 billion an increase of 24% YOY. Taken, that the entire Microsoft Corp reported $50.1 billion for this quarter with 11% growth YOY, the company’s Cloud segment is growing faster than its other products and has nearly reached 50% of the company’s total revenues. Intelligent Cloud revenues accounted for four-fifths of total Azure cloud revenues in Q3 2022, reaching $20.3 billion. [Microsoft]
Cloud Migration Statistics
- The COVID-19 pandemic precipitated cloud migration for many organizations:
- 65% of organizations surveyed said they increased their cloud migration budget after the pandemic’s onset, while 26% kept it aligned with pre-pandemic plans.
- 55% of companies also confirmed that they have reconsidered the number of applications to be migrated to the cloud after COVID-19 while 42% did not.
- Moreover, some companies rushed to complete their cloud migration projects: 16% decreased their initially planned migration timeline and 43% kept it as planned. [McKinsey, ITaaS survey 2020–21]
- Thirty-eight percent of companies failed to meet the planned cloud migration timeline [25% missed the timeline by less than three quarters and 13% were behind schedule by more than three quarters]. At the same time, one-fifth of surveyed organizations were ahead of the planned deadline and 43% completed migration on time. [McKinsey, ITaaS survey 2020–21]
- Seventy-five percent of companies ran over the cloud migration budget, 18% were on the plan, and just 7% managed to spend less than forecasted.
- Over one quarter of businesses [28%] reported budget overruns of more than 20% for their cloud migration activities.
- These cloud migration statistics from Amazon provide good reasons to bid goodbye to on-prem deployment, or at least to go hybrid:
- 20% of companies experienced infrastructure cost savings
- 43% decreased time-to-market for new features
- 45% witnessed fewer security incidents
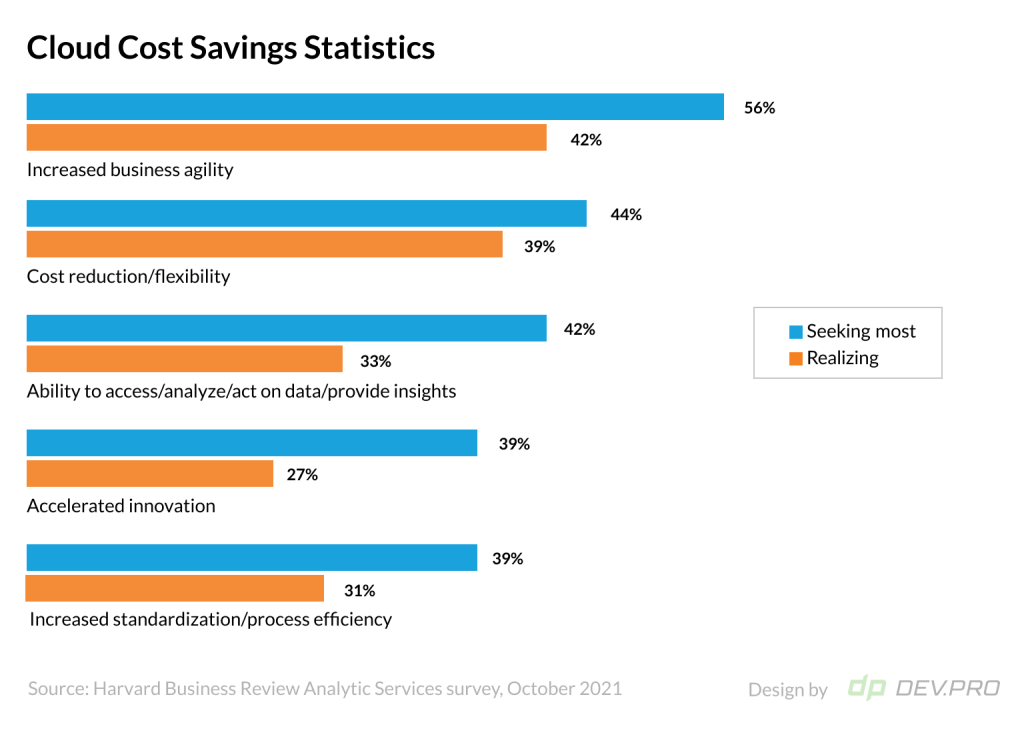
Cloud Cost Savings Statistics
- Thirty-nine percent of organizations managed to achieve some positive results in cost reduction and flexibility as the outcome of cloud investment, while 44% are looking to achieve this goal through cloud computing adoption. [Harvard Business Review Analytic Services survey, October 2021]
- Thirty-one percent of companies use multi-cloud cost management tools.[Flexera State of the Cloud 2022 report]
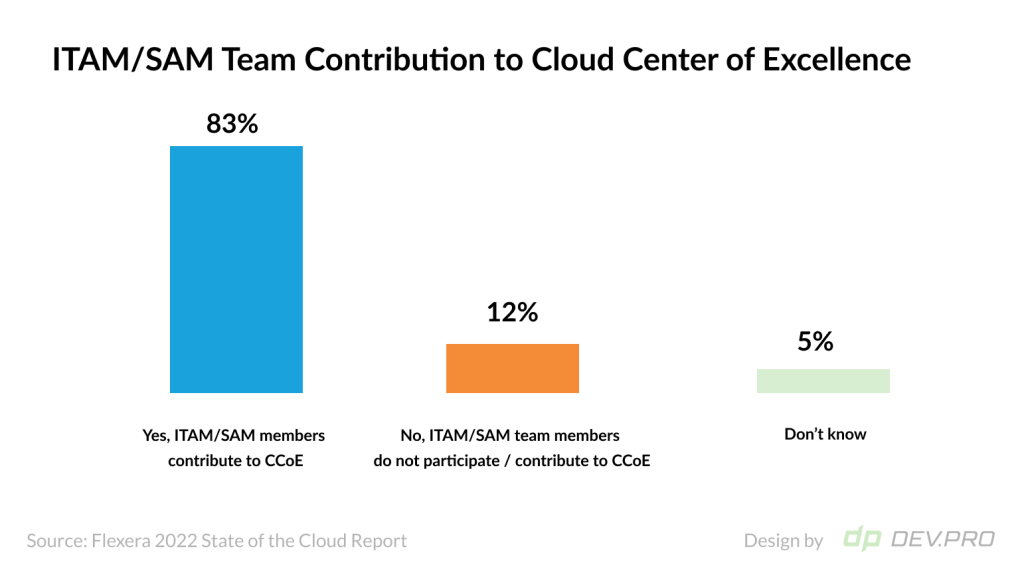
- ITAM/SAM members participate or contribute to their organization’s CCoE (Cloud Center of Excellence) in 83% of organizations. [Flexera, State of IT Asset Management Report, October 2022]
- Eighty-four percent of IT leaders who participated in the Google Cloud and IDG survey believe that their current cloud environment is just safe or even more secure than their on-premise infrastructure. [Google Cloud and IDG]
- IaaS implementation can save anywhere from 30% to 60% of IT infrastructure cost. Up to one-third of the infrastructure cost [33%] could be optimized due to higher utilization, as there is no need for “capacity hoarding” for peak consumption due to immediate availability on demand in the cloud hosting environment. The potential to save another 28% is due to the lower cost unit when sourcing the compute power from the bigger companies with wholesale rates and efficient purchasing practices due to scale. [KPMG. Cloud Economics: Making the Business Case for Cloud]
Cloud Computing Security Statistics
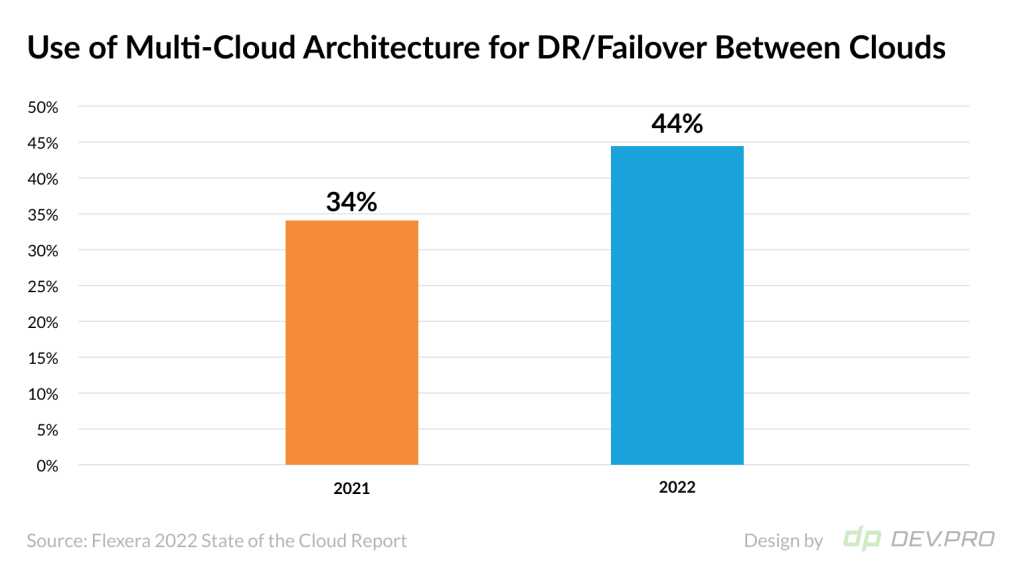
- Strong trend to use multi-cloud set up for Disaster Recovery and Failover between clouds. Forty-four percent of organizations use multi-cloud architecture for DR/Failover between clouds, featuring the most significant growth YOY from 34% in the 2021 survey. [Flexera]
- Forty-nine percent of IT professionals expect or have experienced improved security and compliance as a result of a cloud migration project. [Forrester for Google]
- Eighty percent of respondents experienced at least one cloud security breach in the 18 months. [IDC]
- More than half of the organizations surveyed get alerts about misconfigured cloud services. However, only two-thirds [68%] of companies receiving alerts ever get to fix them. These cloud security statistics reveal little urgency about security warnings, too, as it takes on average 24 days to address such misconfiguration issues. [AquaSecurity].
- Remediation rates are high for critical issues, but there’s no direct dependency between the level of issue severity and remediation rate. Ninety percent of SMB and 73% of enterprises would address critical issues. But high severity issues get the least attention, as only 59% of SMB would address them and less than one-third of enterprises would pay attention. [AquaSecurity]
Conclusive Statistics of Cloud Computing
A lack of cloud experts continues to be a challenge, according to the McKinsey ITaaS survey. Companies predict that by 2024, the estimated spend share for cloud talent will grow for internal and outsourced teams:
- Internally, 35% of the spend in 2021 is forecasted to grow to 48%.
- The outsourced cloud engineers are going to take up more of the IT budget for third party personnel, too, from 46% of the total spend in 2020 to 57% in 2024.
On the other hand, the latest statistics on cloud computing confirm that we are in the mass adoption stage of the technology. The next up-and-coming thing is to further use FinOps principles to drive cloud costs down, to use AI and ML to get more from the terabytes of data, and to employ more Low Code and No Code cloud services for every stage, from development, to deployment, cost optimization, and monitoring.

References:
- Flexera: State of the Cloud Report 2022
- Flexera: State of IT Asset Management Report 2022
- Gartner: Worldwide Public Cloud End-User Spending Report, Gartner, October 2022
- Maximize Market Research: Private Cloud Market: Global Industry Analysis And Forecast [2022-2029]
- HBR report sponsored by Splunk: Accelerating Forward: The State of Cloud-Driven Transformation
- Bloomberg Government: The State of Federal Cloud: Market Briefing, FY 2020
- Amazon.com 3rd quarter results 2022
- Alphabet INC, Form 10-K for the fiscal year 2021
- Google Cloud and IDG survey Solving for Innovation in the Modern Era
- Forrester study commission by Google: State Of Public Cloud Migration, 2022
- Eurostat: Cloud computing services by size class of enterprise, 2021
- European Commission DESI 2022: Digital Economy and Society Index 2022
- Microsoft Microsoft Cloud strength drives first quarter results
- McKinsey & Company: ITaaS survey 2020-21
- Amazon.com: Cloud Migration
- KPMG: Cloud Economics: Making the Business Case for Cloud
- Maximus: FedRAMP survey results
- Aqua Security: Cloud Security Report H1 2021