Key Amazon Elastic Container Service (AWS EC2) performance issues include opaqueness, multi-tenancy, lacking performance commitments, and insufficient internal maintenance. All these lead to the following risks:
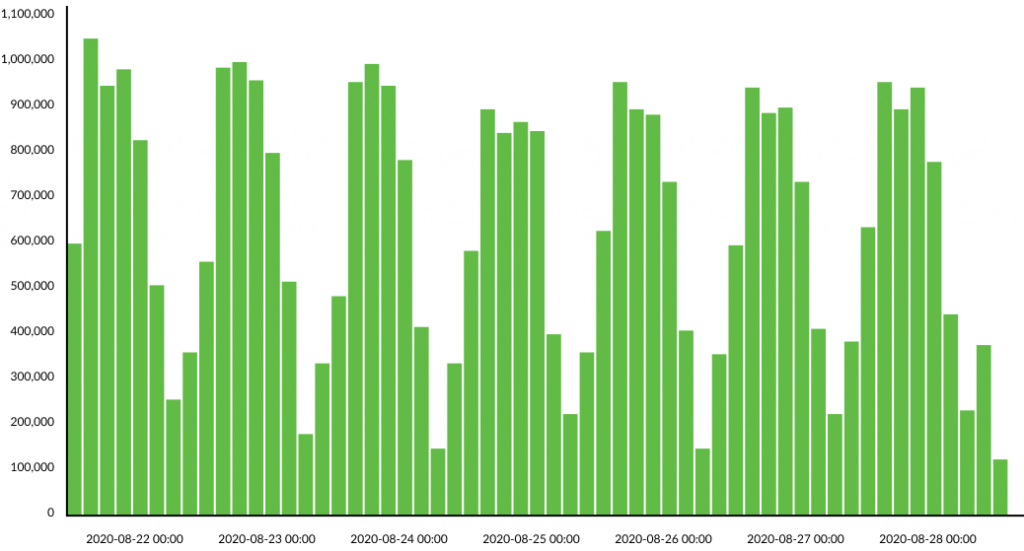
- Additional costs during low load periods if the infrastructure costs aren’t optimized during the day
- 5XX errors during high load periods
- Bottlenecks in the system that cause failover/slowness
- Uncontrollable system behavior through the working cycle
- Unidentified critical system events

If you detect the risks mentioned above in your solution, or want to be proactive in preventing these risks, here are some approaches to improve AWS EC2 performance.
Approach 1: Implement Auto Scaling
If your system needs to handle an increased number of requests without compromising performance and costs, auto scaling is a good solution. It helps avoid 5XX errors during peak workloads and optimizes costs during the day.
Benefits of auto scaling configuration:
- Adds more containers if RAM usage or CPU usage is more than the max boundary value
- Removes extra containers if RAM usage or CPU usage is less than the min boundary value
- Increase number of EC2 nodes if there are no resources to place a new container
- Decrease number of EC2 nodes if there are any nodes without container working

To fix AWS performance issues related to AWS EC2 scaling, CloudWatch as an Amazon-driven monitoring tool is the best option. It will provide you with all necessary data, such as logs, events, metrics, that you need to track in order to get the best visualisation of the current system performance. Moreover, with Amazon CloudWatch you can manage the operational performance to distribute the workload and optimize resource utilization.
CloudWatch will notify you about a variety of critical system events issues and help to keep your application working smoothly.
Approach 2: Cover Critical Events with Log Monitoring
AWS EC2 generates an enormous amount of log messages, which need to be reviewed and analyzed. Log monitoring helps track the collected logs and set up log alerts. Thanks to specialized log management and log monitoring software, you can even simplify your log event searches. This ensures that you don’t miss critical events or face security or compliance challenges.
Despite the fact that cloud-native applications with microservices may require distributed tracing, monitoring logs and events is still crucial for tracking your system behavior.
Benefits of log monitoring:
- Helps control how the system operates
- Finds and eliminates bottlenecks in the system
- Alerts for critical system behavior
If you’d like to set up log monitoring for your solution, we recommend you use the following approaches.
Combination of Elasticsearch and Kibana.
Elasticsearch is a Lucene-driven distributed, multitenant-capable, full-text search engine that tracks your infrastructure logs and metrics. When your data enters into Elasticsearch, it is displayed in Kibana dashboards, a data visualization tool for Elasticsearch. This combination allows you to search, view and interact with the logs, as well as perform data analysis and display the logs in a variety of visualizations.
The second option is Splunk or Datadog with similar functionality.
Another way to resolve AWS efficiency issues related to log management is to build CloudWatch Alarms, either metric or composite. Both alarm types can attach to CloudWatch dashboards and be tracked visually. Alarms based on AWS EC2 metrics have the ability to perform EC2 acts like halting, terminating, rebooting, or restoring an EC2 instance.
When choosing an approach to use, pay attention to the key requirements for log monitoring tools, such as scalability, aggregation level, complexity of data collection and storage, data security, and searching capabilities.
All of the above variations can be used for your project, but remember that Splunk, unlike Elasticsearch, is focusing on enterprise companies and offers a full tool kit out of the box. However, Elasticsearch is less expensive and more adaptable to varying team sizes and scenarios.
When it comes to the visualization tools like Kibana or CloudWatch, they deliver similar results, so the choice between them is simply a matter of convenience.
Approach 3: Monitor All System Bottlenecks
You need to track system behavior and the performance of the cluster to understand if there are any possibilities for infrastructure improvements.
Start with monitoring configurations to find and solve log, flow, and configuration alerts and other indicators that can impact the cluster’s availability and efficiency.
Benefits of system monitoring:
- Finds weak spots in the system and remediates them
- Controls and monitors how the system is working
If you are vague about which monitoring system to choose, consider one of these options: Sumo logic, Splunk, or Datadog. Splunk is a more enterprise-oriented solution. As of May 2021, the service costs $1,800 per year for a 1 gigabyte-per-day license , plus annual support fees. The service is free if you use less than 500Mb per day. If your project is small, you can use DataDog or Sumo logic. Pricing for DataDog starts at $15 per month, while Sumo logic starts at $270 per month. DataDog, unlike two other tools, supports more platforms, including cloud, SaaS, desktop, on-premise and mobile platforms.
With these monitoring systems, you don’t need to set up a complete monitoring process from scratch. All of them will assist you in obtaining personalized dashboards that are compatible with services like Jenkins, New Relic, AWS, Azure, and Kubernetes.
For example, if you use a MongoDB database, the whole monitoring process will be built according to the following structure: MongoDB logs are forwarded to the monitoring tool (e.g. Sumo logic), which highlights bottlenecks in the system that will be resolved later.
Approach 4: Run Performance Testing
Performance testing provides you with the opportunity to find out when your system is ready to go live without any deficiencies.
Performance testing should be added as a mandatory step in the systems development life cycle because performance monitoring is a key part of continuous integration.
Benefits of performance testing:
- Proactively finds and resolves bottlenecks in the system
- Improves optimization and load capability
- Measures the system speed, accuracy, and stability
Tools like Gatling or JMeter provide you with load testing and stress testing capabilities. This will allow you to model the expected level of usage with the help of simulations, as well as find the maximum load that your server can handle.

If you’d like to set up continuous integration and continuous delivery (CI/CD), we recommend using the following combinations: Gatling with Jenkins, TeamCity, or GitHub Actions. Another approach is to apply JMeter with Jenkins or Gitlab CI/CD.
This is because while Gatling and JMeter are popular tools for load and stress testing, while Jenkins and TeamCity offer a simple way to set up a CI/CD environment.
AWS Performance Issues to Solve
The four approaches mentioned above are extremely efficient if you want to:
- Get rid of 5XX errors during rush hours
- Find and resolve bottlenecks in the system that cause failover/slowness
- Control and monitor how your system is working
- Add alerts for critical system events, so your professional DevOps team will be able to react to these alerts
- Optimize infrastructure costs during the day, preventing extra payment during low load
You can also apply all of these approaches at once. They are all essential for addressing AWS performance issues and using only one of them won’t guarantee you optimal e system operations.
If you are wondering how to handle your challenges, turn to Dev.Pro’s experts. We have assisted on projects with similar questions and are happy to help. Schedule a free consulting session now.

