


Ensuring the effectiveness of an outsourced development team is critical to the productivity of individual teams and the success of a project.
Any scale-up that decides to optimize costs and decrease time-to-market by hiring an outsourcing IT services vendor needs to know how to measure these suppliers’ effectiveness.
With more than 160 projects under our belt and a decade of working with the US tech industry, DevPro has plenty of insights into measuring effectiveness. .
The Difficulties of Measuring Outsourced Software Development Vendor Effectiveness
There are several challenges to measuring the effectiveness of a vendor, including:
- Decide what needs to be counted and what is not the right KPI for your project. Think twice about whether industry-wide best practices are the best for your project. Consult with your c-suite and team leads about which metrics will help them drive the team to best results.
- Programming the wrong behavior in your team. Once you create a KPI-tied incentive for your team, they may start developing methods to achieve that KPI, regardless of the consequences.
Why a Scale-up Needs to Know How Their Tech Partner is Performing
Keeping an eye on the achievements of your dedicated team or outsourcing vendor can help you improve performance
But what exactly do you need to measure? How often do you need to monitor your data streams? Where do you start?
The tables below show how Google beat the competition thanks to their developer monitoring efforts. Their first discovery: the company was putting too much time into fixing bugs.
| Source Lines of Code (KSLOC) Generated Per Year | 200 | |
| cell Average Bugs Per 1000 SLOC | × | 8 |
| Number of Bugs in Code | = | 1600 |
| Average Cost to Fix a Bug | × | $1,500 |
| Total Yearly Cost of Bug Fixing | = | $2,400,000 |
| Year Cost of an Engineer | / | $150,000 |
| Number of Engineers Consumed with Bug Fixing | = | 16 |
| Engineering Team Size | / | 40 |
| Percentage of Staff Used for Bug Fixing | 40% | |
Table 1. Metrics from Google
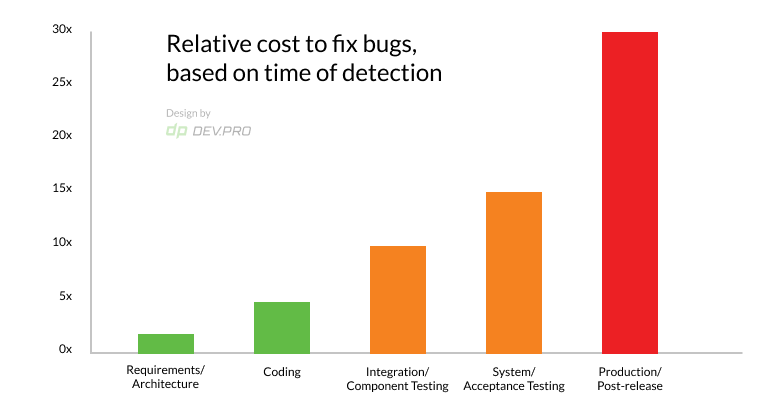
So they decided to start testing earlier in the cycle and continuously. This is how they realized the difference between the cost of fixing bugs was drastically different and saved themselves a few dollars.
| Software Testing Phase Where Bugs Were Found | Estimated Cost per Bug |
| System Testing | $5,000 |
| Integration Testing | $500 |
| Full Build | $50 |
| Unit Testing/Test-Driven Development | $5 |
Major Metrics Used in Software Development, Deployment, Operations
Recently, formal metrics like Lines of Code and code complexity are being replaced by multi-dimensional metrics. Agile productivity, operational and quality metrics are now being used to estimate how well a development team is working.
Developer Productivity:
- Line of Code [KLOC = Thousand of Lines of Code]
Line of Code [LOC or source line of code] remains the most popular unit of measuring a developer’s productivity. However, if used as a KPI for productivity, it can be abused by unnecessarily increasing the number of lines of code to the detriment of the project’s quality.
- Tech Debt
Technical debt is not easy to explain and is difficult to calculate. Also known as the code debt, this is the sum of technical imperfections that accumulate as the project grows. Refactoring is needed for the optimal functioning of the system under new conditions, but this process is often postponed as a result of budget or human constraints. If left unattended, it grows exponentially and is likely to cause issues.
- Code Ownership
Code ownership is a measurement defining percentage of lines authored by a developer in a specific repo in a specific time frame. There are different levels of ownership depending on the level of contribution to the code: those who introduced <50%, >50% or >60% of changes respectively can be named accordingly: minor contributor, major contributor and a file owner.
According to a survey, a strong ownership structure is beneficial for file quality, so weakly owned files and directories could be assigned owners to drive quality.
- Code Churn
Code churn is the proportion of code that’s rewritten or reworked not long after it’s written to the entire written code in a unit of time.
It changes from project to project and from programmer to programmer, but an average of 20-30% should expected. Higher churn rates are expected at the beginning of the project when visibility is low and the architecture is being tested.
Dramatic deviations in the churn rate of the same team within the same project are worthy of attention.
- Code Coverage
Code coverage allows users to estimate the percentage of code that has been covered by manual and automated tests.
It’s a more objective measure than test coverage and has multiple subcategories, like function coverage, statement coverage, branch and loop coverages.
Agile Process:
- Lead Time
Lead time is the time from ticket creation to full release of the feature according to the definition of done.
Lead time = Reaction time [lag] + Cycle time
Software delivery & operational performance metrics by Devop Research and Assessment (DORA)
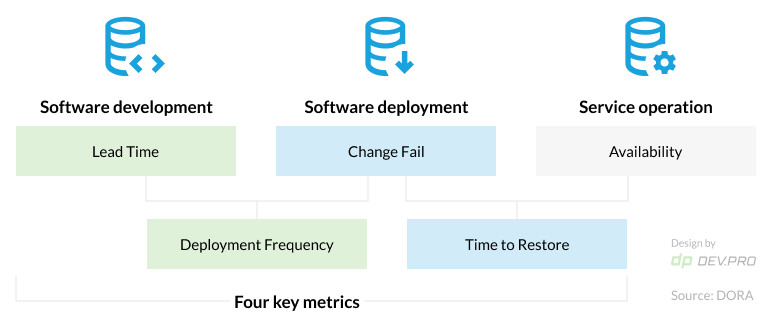
Source: DORA
- Cycle Time
Cycle time is the time it takes to complete a task, from the moment it goes into production until its release.
Both metrics (lead time and cycle time) are great tools for planning and forecasting, especially for similar projects. Control charts are based on these metrics.
- Velocity
Velocity is a team’s ability to complete a number of story points within a certain timeframe. Average velocity is calculated by dividing the number of completed story points by the number of sprints.
It helps to plan and forecast teams work accurately with known velocity for past periods.
For example: with 98 story points completed in 7 sprints, the team’s velocity is 14.
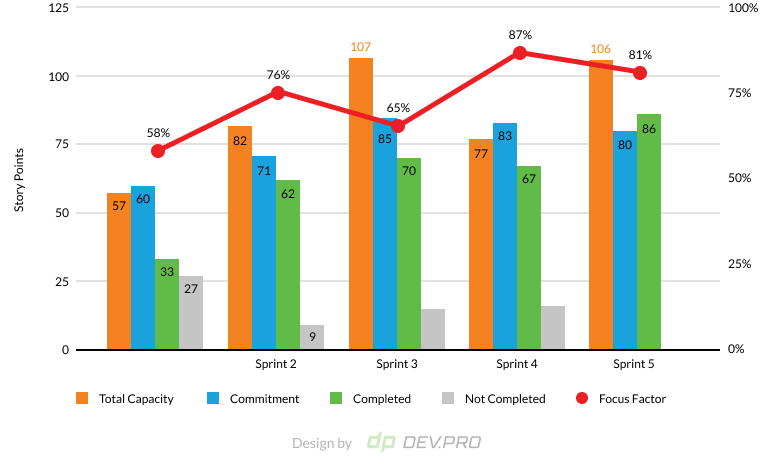
- Focus Factor
Focus factor gauges the engagement of the team into delivering of the value in a unit of time, it is derived by dividing velocity by capacity (total engineering time available for a sprint).
A focus factor of less than 60% signals excessive team distraction or other organizational hiccups.
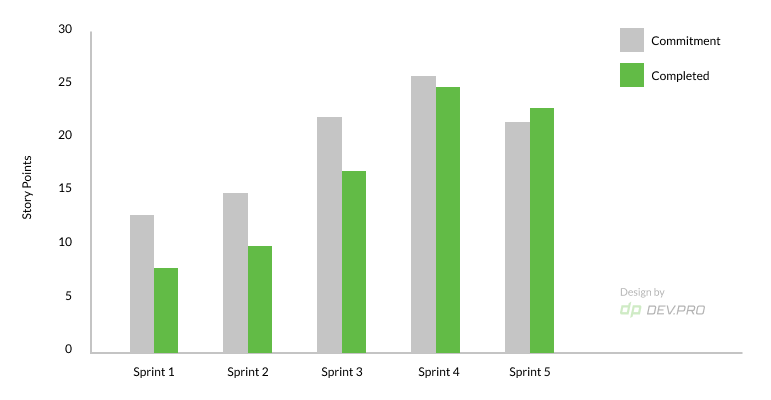
- Commitment Reliability or Say / Do Ratio
The commitment reliability is the difference between committed points and the delivered points. Measured in story points, the graph provides an overview of the discrepancies between what was agreed upon and what was produced as deliverable.
Operational and Maintenance [DevOps]:
- Mean Time Between Failures [MTBF]
Mean Time Between Failures is a metric that defines the reliability of a product. It is calculated by dividing the time in use without breakages or stoppage (uptime) by the number of breakdowns.
Naturally, the longer the MTBF, the more reliable the product is and the less resources you need to fix errors.
- Mean Time to Recover [MTTR]
Mean Time to Recover/Restore defines how much time on average it takes a system or feature to go from downtime to fully operational.
MTTR is calculated by dividing the total downtime by the number of incidents.
The quicker a DevOps team is able to recover the software product, the less damage is incurred by business.
- Mean Time to Resolve [MTTR]
Mean Time to Resolve is the average time needed to fix the bug and take steps to prevent it from recurring. So it’s the Mean Time to Recover from full stop to full operation PLUS the time spent by the team to make sure this bug does not happen again.
- Mean Time to Repair
Mean Time to Repair is usually used in the same meaning as Mean Time to Recover, but applies to physical and mechanical fixes of hardware like servers and disks. The testing period is also included in this metric until the full functionality is restored.
- Cost of Downtime
According to Veeam Data Protection Report 2021, based on a survey of 3000+ IT professionals, the average hourly cost of downtime is $84,650.
The cost depends on the size and scope of your business – be it ecommerce, FinTech, agriculture or other. Facebook lost $90 million in a 14-hour downtime period in March 2019.
To calculate how much your company could lose per minute or per hour, divide the cost of total damage incurred by the minutes or hours the systems were down.
- Deployment Frequency
Deployment frequency is a basic DevOps metric that is used to calculate how often portions of code get deployed.
The best practice is to deploy code often to reduce the quantity and length of duration of the downtime. The Amazon DevOps team deploys code every 11.7 seconds, for example.
Source
Quality & Testing:
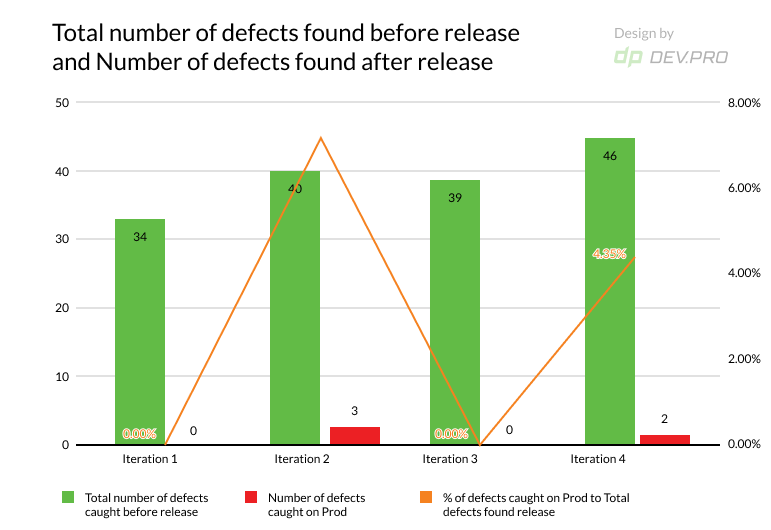
- Defect Leakage / Escaped Defects / Defects Found in Production
The total number of defects found after the sprint closure and / or on a client side. The later the errors are discovered within a cycle, the more expensive they are to fix, so this metric is vital for the client.
- Percentage of Automated Tests Coverage
This metric tells you what ratio of your conducted tests is automated. As time passes, the percentage will grow, signifying the better quality of the output.
- Code Complexity
Code complexity is a measure that allows us to estimate the percentage of the unnecessarily complex code in the total code. As there are multiple ways to develop the same function, an easier shorter code is always a preference. As code is a multi-user medium, the simpler it is, the easier it is to use, fix and maintain for all.
- Defect Spillover
Defect spillover is the number of defects that don’t get fixed within one sprint and are carried as a technical debt to another sprint. Keeping an eye on the metric helps ensure that bug fixing costs less.
- Defect Density
Defect density refers to the quality of code and whether it’s ready to be released. It’s calculated by dividing the number of defects by the size of the code [which can be either KLOC or functional area].
The Bold Print: Multi-Dimensional Metrics Show You the Bigger Picture
These are the two key KPIs we monitor during our projects. The metric we use depends on the methodology of the project.
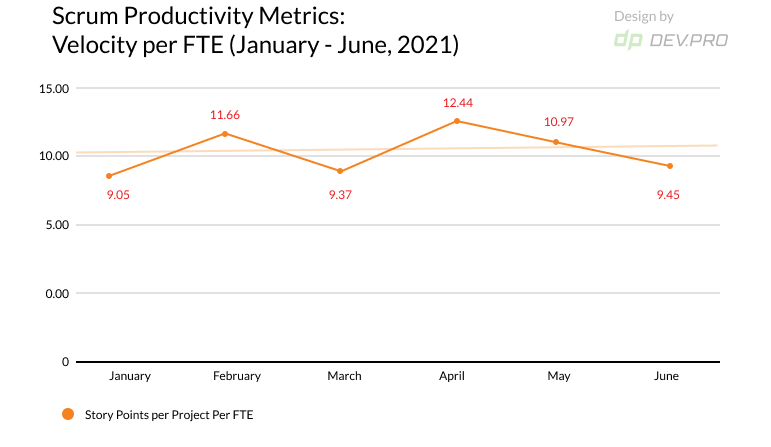
- Velocity Per FTE: For Scrum-Like Projects
Velocity per FTE = number of completed SP per sprint / Number of FTE
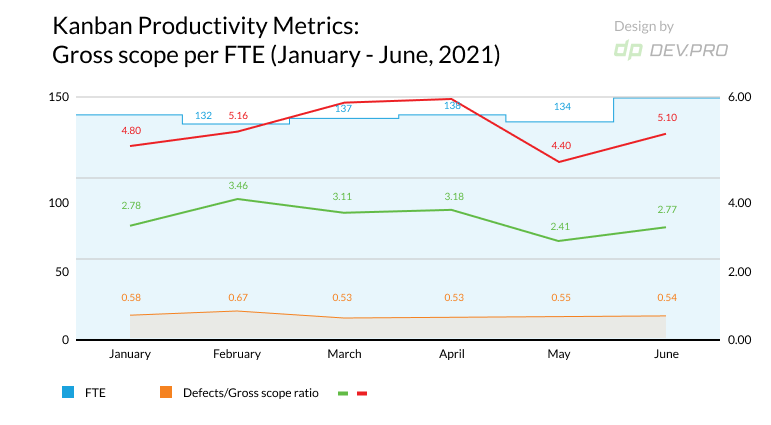
- Gross Scope Per FTE: For Kanban-like Projects
Gross scope per FTE = Business & Tech Debt Completed / Number of FTE
Both of these datasets are then compared to the previous month and the averaged figure for the three months prior. Any deviations in excess of 10% either way will be analyzed to determine if further action is required.
Understanding How Effective Your Outsourcing Team Is: Where to Start
When embarking on a road to outsourcing, you want to be sure that you can measure the output of your team. A transparent relationship between you and your tech partner will strengthen your relationship and reinforce trust.
On a grand scale of things, while knowing every single one of development metrics is useful, it’s not necessary to micro-manage and drill down into each of them for the client. Team leads and delivery managers should have the carte blanche to leverage those tools in order to deliver upon the contractually agreed scope of work.
Many of DevPro’s clients create reports for measuring productivity or speed of delivery of the internal team of engineers. When we work with those clients, we agree to extend similar reporting to the outsourced part, as well.
If you don’t want to take such a time-intensive approach, you can just keep an eye on the Velocity per FTE or Gross Scope per FTE. Usually, our Project Managers would send this report with explanation of any deviations exceeding 10% to the compared period.
Are you looking to hire an IT services outsourcing vendor? Talk to our sales team and receive an estimate within 24 hours.